Reducing Climate-Change-Induced Heat Strain and HVAC Performance Loss With Circulating Fans
With the rate of climate change accelerating and predicted outcomes growing more dire, the authors examine the potential of air-circulating fans to mitigate increased occupant heat strain in heated-and-ventilated-only warehouses and improve the resilience of mechanical systems and maintain occupant thermal comfort in conditioned commercial buildings.
In 1990, the Intergovernmental Panel on Climate Change (IPCC), the United Nations (U.N.) body for assessing the science related to climate change, released its First Assessment Report,1 detailing the impacts human activities were having on atmospheric greenhouse-gas concentrations and tropospheric air temperature. The report predicted global mean air temperature would rise by an average of 0.54°F (0.3°C) per decade in the 21st century, or 5.4°F (3.0°C) by the year 2100, an outcome that would be devastating for the environment and many of the world’s most vulnerable populations, which would suffer the effects of more frequent severe-weather events, sea-level rise of up to 3.3 ft (1 m), and food insecurity.
Flash forward to 2021 and the release of IPCC Working Group I’s contribution to the Sixth Assessment Report, which the U.N. secretary-general called a “code red for humanity.”2 While international treaties such as the Kyoto Protocol and the Paris Agreement were designed to cap mean-temperature increase at 2.7°F (1.5°C), the most likely greenhouse-gas-concentration trajectory adopted by the IPCC, the intermediate representative concentration pathway (RCP) of 4.5, sees a mean-temperature increase of up to 6.3°F (3.5°C) by the end of the century.3 In short, it is becoming increasingly clear that the 2.7°F (1.5°C) target will be exceeded, and it could happen as soon as 2050.3
This article will examine the predicted performance of buildings at significant risk from climate change and illustrate how the use of circulating fans can reduce cooling demand in conditioned buildings and heat strain in unconditioned ones under increasingly demanding climatic conditions.
Contextualizing Global Impacts and Existing Works
One of the greatest communication challenges in climate science is “consensus gap,” or the dissonance between analytical, scientific, and numerical effects of climate change (e.g., rise in mean temperature) and more human, contextual, and observational impacts of climate change (e.g., seasonal temperature, drought). Researchers at ETH Zurich leveraged connections between what populations subjectively know about and associate with their current climates to underscore the dramatic changes that will occur under the RCP-4.5 scenario by 2050, selecting 520 cities around the world and applying statistical models to 19 independent bioclimatic variables to determine the cities’ best future climatic analog.4
Distilling the results of the ETH Zurich study, Table 1 shows the future climatic analog of cities in 15 climate zones (CZ) used in U.S. Department of Energy (DOE) reference-model simulations and in ANSI/ASHRAE Standard 169-2021, Climatic Data for Building Design Standards.5 For context, 2017 annual heating degree-days based on 65°F (HDD65) and 2017 annual cooling degree-days based on 50°F (CDD50) from the ASHRAE Climatic Design Conditions database are given.

David Rose

Will Conner
| Representative City | CZ | HDD65 | CDD50 | |||||||||
|---|---|---|---|---|---|---|---|---|---|---|---|---|
| Miami, Fla. | 1A | 113 | 9,942 | |||||||||
| Houston, Texas | 2A | 1,167 | 7,630 | |||||||||
| Phoenix. Ariz. | 2B | 912 | 9,229 | |||||||||
| Atlanta, Ga. | 3А | 2,640 | 5,391 | |||||||||
| Las Vegas, Nev. | 3B | 1,975 | 7,249 | |||||||||
| San Francisco, Calif. | 3C | 3,779 | 1,835 | |||||||||
| Baltimore, Md. | 4A | 4,491 | 3,936 | |||||||||
| Albuquerque, N.M. | 4B | 3,956 | 4,271 | |||||||||
| Seattle, Wash. | 4C | 4,705 | 2.068 | |||||||||
| Chicago, Ill. | 5A | 6,190 | 3,122 | |||||||||
| Boulder, Colo. | 5B | 10,865 | 369 | |||||||||
| Minneapolis, Minn. | 6A | 7,477 | 2,882 | |||||||||
| Helena, Mont. | 6B | 7,504 | 2,092 | |||||||||
| Duluth, Minn. | 7 | 9,286 | 1,674 | |||||||||
| Fairbanks, Alaska | 8 | 13,577 | 1,087 |
| Future Climatic Analog | Future CZ | HDD65 | CDD50 | |||||||||
|---|---|---|---|---|---|---|---|---|---|---|---|---|
| Rio de Janeiro, Brazil | 1A | -106 | -391 | |||||||||
| Jacksonville, Fla. | 2A | 136 | -670 | |||||||||
| Kuwait City, Kuwait | 1B | -201 | 1,808 | |||||||||
| Memphis, Tenn. | 3А | 244 | 325 | |||||||||
| Phoenix, Ariz. | 2B | -1,063 | 1,980 | |||||||||
| Lisbon, Portugal | 3C | -2,083 | 3,165 | |||||||||
| Nashville, Tenn. | 3A | -1,000 | 946 | |||||||||
| El Paso, Texas | 3B | -1,656 | 1,874 | |||||||||
| San Francisco, Calif. | 3C | -926 | -233 | |||||||||
| St. Louis, Mo. | 4A | -1,518 | 1,017 | |||||||||
| Amarillo, Texas | 4B | -6,822 | 3,981 | |||||||||
| Kansas City, Mo. | 4A | -2,450 | 1,166 | |||||||||
| Salt Lake City, Utah | 5B | -2,038 | 1,474 | |||||||||
| Toledo, Ohio | 5A | -3,381 | 1,587 | |||||||||
| Winnipeg, Canada | 7 | -3,212 | 728 |
| Portland. Ore. | Jan. | Feb. | Mar. | Apr. | May. | Jun. | Jul. | Aug. | Sep. | Oct. | Nov. | Dec. |
|---|---|---|---|---|---|---|---|---|---|---|---|---|
| 2% DB (°F) | 54.9 | 57.3 | 64.6 | 71.7 | 81.2 | 84.5 | 91.3 | 90.2 | 86.6 | 72.2 | 59.8 | 53.6 |
| 2% MCWB (°F) | 50.7 | 49.5 | 52.5 | 57 | 61.9 | 64.6 | 68.4 | 67.6 | 63.9 | 58 | 55.2 | 50.5 |
| 2% DB (°C) | 12.7 | 14.1 | 18.1 | 22.1 | 27.3 | 29.2 | 32.9 | 32.3 | 30.3 | 22.3 | 15.4 | 12.0 |
| 2% MCWB (°C) | 10.4 | 9.7 | 11.4 | 13.9 | 16.6 | 18.1 | 20.2 | 19.8 | 17.7 | 14.4 | 12.9 | 10.3 |
TABLE 2. Monthly 2-percent cooling design conditions for Portland, Ore.; San Antonio, Texas; Jacksonville, Fla.; and Orlando, Fla. (Note: DB = dry bulb, MCWB = mean coincident wet bulb).
Implications for the Built Environment
For much of the world, the significant climatic changes anticipated for Portland, Ore., (future climatic analog: San Antonio, Texas) are much more typical than the somewhat lesser ones for Jacksonville, Fla. (future climatic analog: Orlando, Fla.). To illustrate, ASHRAE 2-percent monthly design conditions are shown in Table 2. Undoubtedly, these changing conditions will make the design and operation of commercial buildings more of a challenge, a challenge compounded by factors related to climatic-data acquisition, code development, code adoption, and misapplication of mechanical-design elements.
For large commercial buildings with low internal heat loads, such as warehouses and light-manufacturing facilities, climatic conditions can have an outsized impact on building performance. ANSI/ASHRAE Standard 169-2021 defines design conditions for more than 5,500 locations worldwide. Also, it provides climate zones (e.g., 4A, 2B) that enable easy characterization and comparison of thermal and moisture conditions. At the same time, however, it relies on historical averages from the previous 30 years. In decades past, when climates were not changing as rapidly, this would not have been an issue. But a building with a projected lifespan of 50 years constructed today likely will experience environmental conditions dramatically different from those of the 1990s through the 2010s used in its design.
This problem will only be compounded by lags in the development of standards and the adoption of standards into building codes. Take, for example, ANSI/ASHRAE/IES Standard 90.1, Energy Standard for Buildings Except Low-Rise Residential Buildings, which is on a three-year publication cycle and adoption of which can vary widely. As of this writing, only 19 states have adopted ANSI/ASHRAE/IES Standard 90.1-2016 or an equivalent later standard (e.g., the 2018 International Energy Conservation Code, the 2018 Washington State Energy Code, the 2019 California Energy Code), while 12 either have no commercial building code or are using ANSI/ASHRAE/IES Standard 90.1-2010 or an earlier equivalent standard.6 While current codes and standards are based on measures and methods proven in the recent past, the requirements and guidelines they set forth may not be as effective under future climatic conditions.
For a representative grocery store in San Francisco, researchers from the University of California, Berkeley’s Center for the Built Environment (CBE) evaluated the performance of 57 energy-conservation measures using both current and future climatic conditions. Of the 57 measures studied, only 24 were deemed effective under current conditions. Of those 24, only 15 were deemed effective under future conditions. (Interestingly, 10 of 14 measures deemed ineffective under current conditions were found to be more effective under future conditions.)7
The study shows just how dramatically conditions can change and prompted us to think about the potential impact of cooling effects from air-circulating fans for various applications. While much of the discussion of climate change and buildings has been focused on the use and conservation of energy in conditioned spaces, it is imperative to also focus on the effects of heat strain on occupants, which the Occupational Safety and Health Administration has made a point of national emphasis.8 With that in mind, two questions were identified for exploration:
- Can cooling effects provided by air-circulating fans mitigate climate-change-induced increases in occupant heat strain in heated-and-ventilated-only warehouses?
- Can cooling effects provided by air-circulating fans improve the resilience of existing mechanical systems while maintaining occupant thermal comfort amid changing climatic conditions?
Modeling Methods
The modeling methods used for our condensed study were not designed to be as rigorous as those for some existing works examining specific building uses. To address the two questions above while leveraging existing works as much as possible, our approach included using DOE reference building energy models, existing TMY3 (typical meteorological year) data indexed to future and current climate states, and tools such as CBE Thermal Comfort Tool, the National Weather Service’s (NWS) Heat Index Calculator, and a brand of commercial design and analysis software.
Two DOE commercial reference buildings9 were selected and minimally changed for the study:
- To study heat-strain effects in an unconditioned environment (first question), the warehouse reference building was selected. This building type is representative of spaces that often are unconditioned and typically have low occupant density, low internal loads, and a high envelope load, such as hangars, light-manufacturing facilities, and fleet-maintenance operations. This is the building model used in a study of thermal comfort in heated-and-ventilated-only warehouses under current climatic conditions.10
- To study the second question, the medium-office reference building was simplified to be single-story but with the same floor area and other characteristics. This building type has a medium occupant density and a medium internal equipment load typical of education environments, retail environments, and other public spaces that usually are conditioned.
Energy modeling was conducted for each city shown in Table 1 using the radiant-time-series heat-balancing method in the commercial design and analysis software and TMY3/EnergyPlus Weather (EPW) data. Each facility was simulated across all 8,760 hours of a year with and without air-circulating fans under current and future climatic conditions. The results of each simulation yielded hourly indoor-air conditions, HVAC design capacity, and yearly HVAC electrical consumption. These results were used to address the questions above. With the hourly indoor-air conditions, indoor-air dry-bulb temperature and relative humidity were used to calculate heat index for each hour as prescribed by the NWS,11 and the heat indices were grouped into heat-strain health-risk categories. Cooling effect provided by airflow from air-circulating fans was calculated using CBE Thermal Comfort Tool’s pythermalcomfort package.12 The cooling effect for each hour was subtracted from the dry-bulb temperature in a subsequent heat-index calculation to show the impact of air-circulating fans in terms of heat-index exposure.
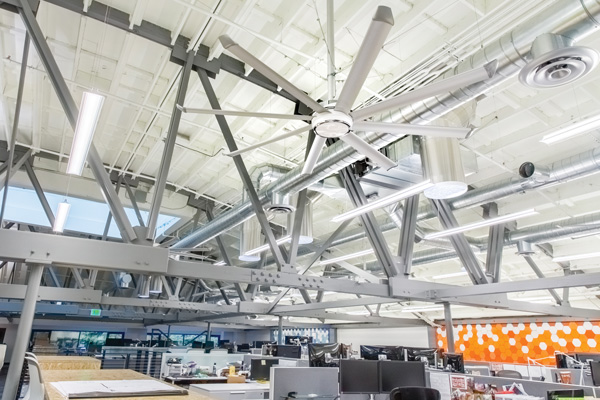
High-volume-low-speed (HVLS) air-circulating fan installed in a conditioned office. Photograph courtesy of Big Ass Fans
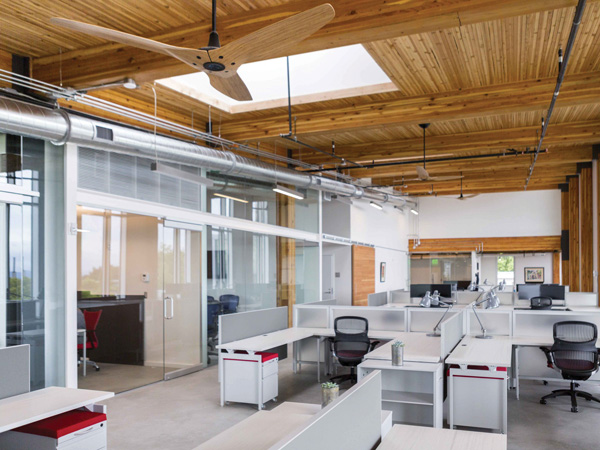
High-speed-small-diameter (HSSD) air-circulating fans installed in a conditioned office. Photograph courtesy of Big Ass Fans
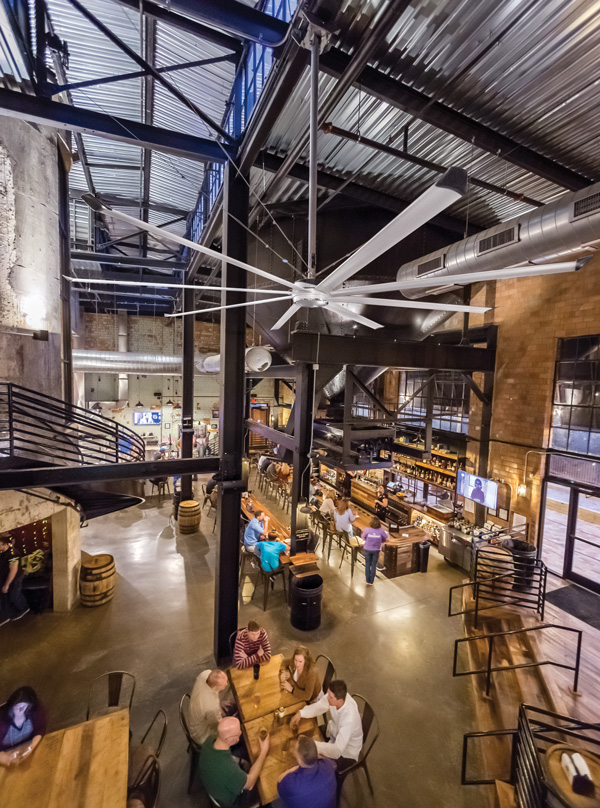
Large-diameter ceiling fan (LDCF) installed in a conditioned restaurant. Photograph courtesy of Big Ass Fans
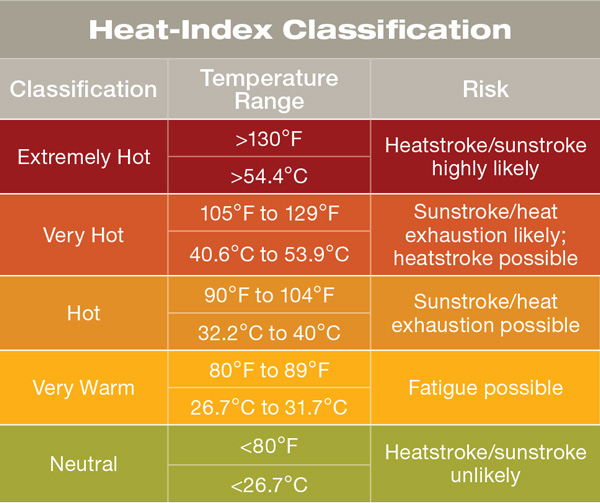
TABLE 3. National Oceanic and Atmospheric Administration (NOAA) heat-index heat-strain-risk classifications.
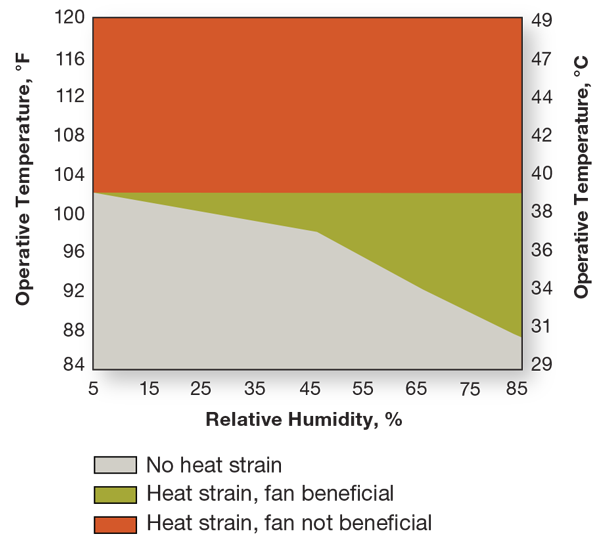
FIGURE 1. Heat-strain conditions under which air-circulating fans can be effective.
Occupant Heat Strain in Heated-and-Ventilated-Only Warehouses
Heat stress is the result of increased heat load on a person’s body. When heat load exceeds the body’s ability to reject heat, the physiological response is referred to as heat strain. Frequently, heat strain is contextualized in terms of heat index, which can be calculated based on the dry-bulb temperature and the moisture content of air, most often in terms of relative humidity. As Table 3 shows, heat index can be classified according to heat-strain effects associated with exposure. Note that for the purposes of this study, “dangerous” levels of heat strain are conditions under which the heat index is above 90°F (32.2°C) and symptoms more significant than fatigue are possible.
Indoor-air conditions of heated-and-ventilated-only warehouses of typical construction are driven primarily by the influence of envelope loads (i.e., internal loads typically are limited). This makes warehouses particularly vulnerable to changes in outdoor-air conditions, such as those caused by climate change. A representative warehouse occupant who is physically active and dressed to common standards (1.7 MET, 0.57 Clo) is at greater risk of heat strain than a worker in another environment with more adaptive clothing or who works at a lower metabolic rate. Heat-strain occurrence among warehouse workers is a growing concern and expected to become significantly worse across nearly every climate zone, if mitigating measures are not put in place.
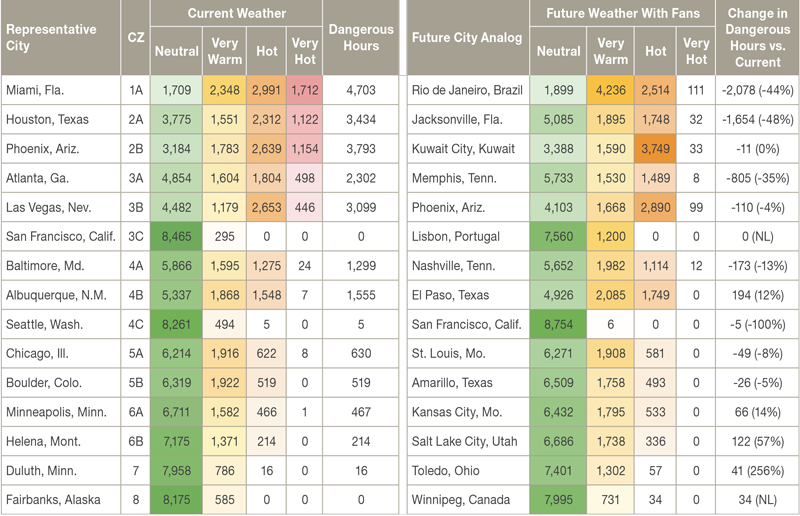
Table 4 shows the results of building-energy-model simulations of the representative warehouse in the current climates of the 15 cities in Table 1 and under the future weather conditions of the cities’ climatic analogs. Note the shifts to the “very hot” extremes and away from neutral conditions. On average, the cities are expected to experience a 627-hour increase in dangerous heat-strain conditions, with those in climate zones 4B, 5A, 6A, and 6B expected to experience an average increase of more than 1,000 hours.
With no mechanical cooling system, temperature and relative humidity can be difficult to control in a heated-and-ventilated-only building. Recent research, however, shows that providing air at elevated speeds at occupant level from devices such as air-circulating fans can be beneficial at operative temperatures as high as 102°F (38.9°C), even for occupants with relatively high metabolic rates, such as warehouse associates.13 At 85°F (29.4°C) and 50-percent RH—approximately the average indoor-air conditions of a ventilated-only warehouse—air-circulating fans can provide more than 9°F (5°C) of cooling effect for a warehouse associate. Figure 1 is a graphical summary of the calculations in the research.13 Providing air at elevated speeds amid extreme temperatures has proven highly beneficial, as supplying mechanical cooling to a building the size of a warehouse often is both energy-inefficient and financially impractical.
Table 5 shows building-energy-model-simulation heat-index-calculation results with cooling effects from fans. Heat-strain hours are reduced significantly, even compared with current climatic conditions. On average, the results show a reduction of 296 dangerous-heat-strain hours, with significant improvements in exceptionally hot and humid environments (e.g., zones 1A and 2A) and efficient mitigation leading to much smaller increases in the zones identified in Table 4 as the most concerning.
Occupant Heat Strain in Heated-and-Ventilated-Only Warehouses
Heat stress is the result of increased heat load on a person’s body. When heat load exceeds the body’s ability to reject heat, the physiological response is referred to as heat strain. Frequently, heat strain is contextualized in terms of heat index, which can be calculated based on the dry-bulb temperature and the moisture content of air, most often in terms of relative humidity. As Table 3 shows, heat index can be classified according to heat-strain effects associated with exposure. Note that for the purposes of this study, “dangerous” levels of heat strain are conditions under which the heat index is above 90°F (32.2°C) and symptoms more significant than fatigue are possible.
Indoor-air conditions of heated-and-ventilated-only warehouses of typical construction are driven primarily by the influence of envelope loads (i.e., internal loads typically are limited). This makes warehouses particularly vulnerable to changes in outdoor-air conditions, such as those caused by climate change. A representative warehouse occupant who is physically active and dressed to common standards (1.7 MET, 0.57 Clo) is at greater risk of heat strain than a worker in another environment with more adaptive clothing or who works at a lower metabolic rate. Heat-strain occurrence among warehouse workers is a growing concern and expected to become significantly worse across nearly every climate zone, if mitigating measures are not put in place.
Table 4 shows the results of building-energy-model simulations of the representative warehouse in the current climates of the 15 cities in Table 1 and under the future weather conditions of the cities’ climatic analogs. Note the shifts to the “very hot” extremes and away from neutral conditions. On average, the cities are expected to experience a 627-hour increase in dangerous heat-strain conditions, with those in climate zones 4B, 5A, 6A, and 6B expected to experience an average increase of more than 1,000 hours.
With no mechanical cooling system, temperature and relative humidity can be difficult to control in a heated-and-ventilated-only building. Recent research, however, shows that providing air at elevated speeds at occupant level from devices such as air-circulating fans can be beneficial at operative temperatures as high as 102°F (38.9°C), even for occupants with relatively high metabolic rates, such as warehouse associates.13 At 85°F (29.4°C) and 50-percent RH—approximately the average indoor-air conditions of a ventilated-only warehouse—air-circulating fans can provide more than 9°F (5°C) of cooling effect for a warehouse associate. Figure 1 is a graphical summary of the calculations in the research.13 Providing air at elevated speeds amid extreme temperatures has proven highly beneficial, as supplying mechanical cooling to a building the size of a warehouse often is both energy-inefficient and financially impractical.
Table 5 shows building-energy-model-simulation heat-index-calculation results with cooling effects from fans. Heat-strain hours are reduced significantly, even compared with current climatic conditions. On average, the results show a reduction of 296 dangerous-heat-strain hours, with significant improvements in exceptionally hot and humid environments (e.g., zones 1A and 2A) and efficient mitigation leading to much smaller increases in the zones identified in Table 4 as the most concerning.
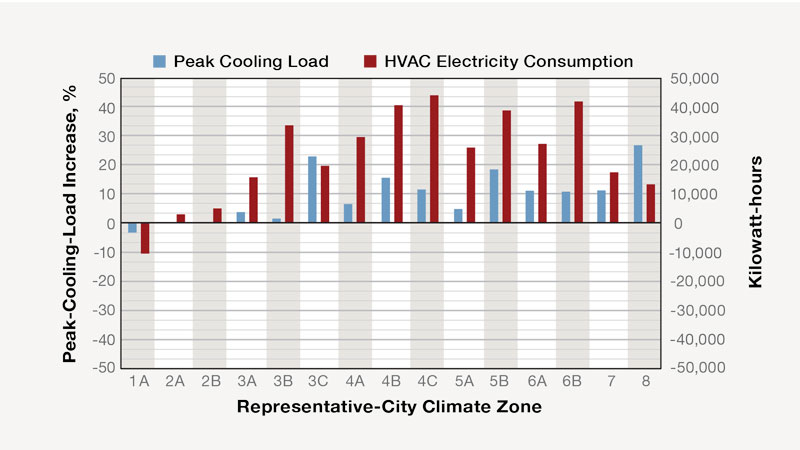
FIGURE 2. Comparison of HVAC-system performance with no fans, future conditions.
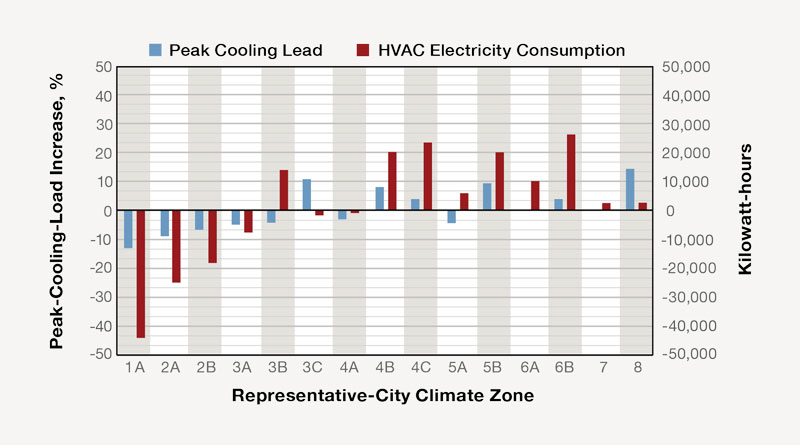
FIGURE 3. Comparison of HVAC-system performance with fans, future conditions.
Peak Cooling Load and HVAC Energy Use in Existing Commercial Spaces
Unlike warehouses, the vast majority of smaller commercial spaces, such as offices, fitness facilities, restaurants, and stores, are conditioned. While the loading profiles of these spaces are inherently different than those of a warehouse (much smaller, with more internal and latent loads), the spaces are not immune to significant performance impacts from changing weather conditions, as it is possible their mechanical systems will be unable to keep up with envelope and ventilation loads they simply were not designed for and will require more energy to maintain desired performance, even in partial-load situations.
To examine the question of whether cooling effects provided by air-circulating fans can improve the resilience of existing mechanical systems while maintaining occupant thermal comfort amid changing climatic conditions, the medium-office DOE reference model was analyzed across the same 15 climate zones for a scenario with no fans and a standard cooling setpoint (72°F/22.2°C) and for a scenario with fans and an elevated setpoint (80°F/26.7°C). Occupant comfort was identical across the two scenarios for both current and future weather conditions. Two results—peak cooling load in tons of cooling required and annual HVAC cooling energy use in kilowatt-hours of electricity—were recorded for each simulation.
Figures 2 and 3 show that, without mitigation, peak cooling load and HVAC energy consumption increased in all but one climate zone (1A). On average, peak cooling load increased by 9.7 percent and HVAC energy consumption increased by more than 23,000 kWh (42.6 percent) relative to current climatic conditions. When air-circulating fans were added and the setpoint was increased, performance under future weather conditions was much more similar to that under current weather conditions, with multiple climate zones seeing decreases in peak load and energy consumption and others seeing significantly smaller gains than in scenarios without fans and an elevated setpoint. On average, with fans, cooling capacity increased by only 0.1 percent, while energy use relative to current conditions increased by only about 1,700 kWh (9.6 percent).
Conclusion
Returning to the two questions that formed the basis of the research presented in this article:
Can cooling effects provided by air-circulating fans mitigate climate-change-induced increases in occupant heat strain in heated-and-ventilated-only warehouses?
Yes. With a properly designed fan solution delivering airflow to occupants in a heated-and-ventilated-only warehouse, the effects of indoor conditions that could lead to greater occupant heat strain under future climatic conditions can be significantly reduced. In some cases, the addition of fans even improves future conditions relative to current ones.
Can cooling effects provided by air-circulating fans improve the resilience of existing mechanical systems while maintaining occupant thermal comfort amid changing climatic conditions?
Yes. The demonstrated abilities of fans to supplement air-conditioning systems and offset design loads show fans’ potential as a means to address future cooling challenges. Owners of existing buildings who add fans will be able to mitigate predicted increases in cooling-load demand and electricity consumption, while owners of yet-to-be-constructed buildings who utilize fans will be able to maintain a reasonable design cooling load. In short, the use of fans will ensure safer and more efficient buildings under future climatic conditions.
While the scope of this analysis is relatively limited, the results show interesting potential for further and more rigorous research.
References
- IPCC. (1990). IPCC first assessment report. Geneva, Switzerland: Intergovernmental Panel on Climate Change.
- UN. (2021, August 9). IPCC report: ‘Code red’ for human driven global heating, warns UN chief. Retrieved from https://bit.ly/IPCC_CodeRed
- IPCC Working Group I. Climate change 2021: The physical science basis. (Cambridge, UK and New York: Cambridge University Press, forthcoming).
- Bastin J-F, et al. (2019). Understanding climate change from a global analysis of city analogues. PLOS ONE, 14. Retrieved from https://bit.ly/Bastin_Understanding
- ASHRAE. (2021). Climatic data for building design standards. ANSI/ASHRAE Standard 169. Peachtree Corners, GA: ASHRAE.
- ICC. (2021, August). International codes-Adoption by state (August 2021). Retrieved July 8, 2022, from https://bit.ly/Codes_Adoption
- Aijazi, A.N., Best, R., & Schiavon, S. (2019, September). Optimizing energy conservation measures in a grocery store using present and future weather files. Proceedings of the International Building Performance Simulation Association, 16. Retrieved from https://bit.ly/Aijazi_0919
- OSHA. (2021, October 26). US Department of Labor initiates rulemaking to protect workers, outdoors and indoors, from heat hazards amid rising temperatures. Retrieved July 8, 2022, from https://bit.ly/OSHA_102621
- EERE. (n.d.). Commercial reference buildings. Retrieved from https://bit.ly/Reference_Buildings
- Taber, C., & Colliver, D. (2018, December). Thermal comfort in heated-and-ventilated-only warehouses. ASHRAE Journal, pp. 12-18. Retrieved from https://bit.ly/Taber_Colliver
- National Weather Service. (n.d.). Heat forecast tools. Retrieved July 8, 2022, from https://bit.ly/Heat_Forecast
- Tartarini, F., Schiavon, S., Cheung, T., & Hoyt, T. (2020, July 1). CBE Thermal Comfort Tool: Online tool for thermal comfort calculations and visualizations. SoftwareX, 12. Retrieved from https://bit.ly/SoftwareX_CBE
- Tartarini, F., Schiavon, S., Jay, O., Arens, E., & Huizenga, C. (2022, January). Application of Gagge’s energy balance model to determine humidity-dependent temperature thresholds for healthy adults using electric fans during heatwaves. Building and Environment. Retrieved from https://bit.ly/Tartarini_Gagge
About the Authors
David Rose is senior manager for technical strategy and innovation and Will Conner is an engineer for Big Ass Fans.
This article appears in the 2022 edition of AMCA inmotion magazine.
Whether you have an industrial complex or a small shop, our airflow experts are here to make your life easier, more comfortable, and less expensive.
Reach out to our airflow experts for a quote today!